Ethloop - local simulator for testing Linux QoS disciplines
Martin Devera aka devik (devik@cdi.cz)
Last updated: 3.5.2002
What is it
Ethloop is very simple and versatile packet generator and measurer
which I use to test HTB qdisc. It is developement tool and you take
it as such. It accepts controling program at stdin, executes it
and produces flow rate table at stdout.
The generated rate is output on interface(s) selected in program
and data are recieved on all interfaces in a system. You sometimes
need to set promisc flag on recieving interfaces.
Generated packets are ethernet frames with protocol set to ETH_P_CUST
so that you can safely inject them into existing LANs. MAC addresses
are set to MACs of sending/recieving interface (may be the same).
Wired loopback
When you have only one ethernet card and still want to test on real hw
(not on lo device) you can create loopback connector. It is normal TP
8 pin connector where you interconnect pins 1-3 and 2-6. It works for
both 10 and 100Mbit and full duplex.
Other interface setup
You don't need to set IP adress for used interfaces. Ethloop's packets
are not IP packets. It will work with loopback (lo) device on linux,
with one eth equiped with wired loopback connector (see above) or more
eth cards in single computers if these are interconnected by hub/switch
or crosscable.
Don't forget ifconfig ethX up if you are not using that interface
regulary.
Controling program
The controling program is line based text file. Each line has fixed
format and comment lines behins with #. The format of a line is:
5000 R 2 4500000
Number of spaces is optional and tabs can be used. Input is parsed
by sscanf "%u %c %u %n". The first number is time in
miliseconds from program start. The second character determines
operation to do. Third number is flow id (see below)
and remainder of line is operation dependent. However the remainder can be text
or number and numbers are allowed in decimal or hex (if starting with 0x).
Number can end with k to multiply it by 1024.
The line above means: at time 5sec set rate of flow 2 to 4.5 MBps.
Lines are first read into struct progdata in memory (performance reasons)
and should be in increasing time order. Ethloop performs no sorting
by time so be carefull about it.
Each line is executed at its time and can change ongoing traffic generators.
Flows
Flow is elementary object in Ethloop. Flow has many properties as sending rate,
rate jitter, incoming and outgoing interface .. see struct flowtab for
complete list if you are interested.
Each flow is really "flow" of packets with some properties. Ethloop generates the flow
and measures some properties of recieved packets which belongs to the flow. Each
packet carries information about flowid inside. You can exploit it with u32 QoS filter
but there are better ways.
See command reference later in this document to understand all flow related parameters.
Example
Let's see simple example. We want to simulate two companies sharing single link
with HTB qdisc. We will use interface lo for test (everyone has one). We will
add TBF to the lo interface with 100kbps rate.
tc qdisc add dev lo root tbf rate 100kbps burst 10k limit 10k
Now let's create simple simulation program. Both companies will start to transmit
packets at 100kbps and second one will change to 50kbps and then to 10kbps later.
# Two flow simulation

# lo will be used to TX and RX
0       i       0       lo
0       i       1       lo

# set simulation packet size to 1k
0       S      0        1k
0       S      1        1k

# start both flows
0       R      0        100k
0       R      1        100k

# flow 1 to 50k and 10k later
2000    R      1        50k
4000    R      1        10k

# finish at 6sec
6000    X      0        0
Store it into file prog and run. You should see:
[root@devix ethloop]# ./ethloop < prog
read program 9 commands
store 0 at 508 ms
store 1 at 1007 ms
store 2 at 1507 ms
store 3 at 2007 ms
store 4 at 2507 ms
store 5 at 3007 ms
store 6 at 3507 ms
store 7 at 4007 ms
store 8 at 4506 ms
store 9 at 5006 ms
store 10 at 5505 ms
store 11 at 6017 ms
0.5 53506 42798 49 0 53506 43610 63 0
1.0 67953 62392 84 0 67953 36488 97 0
1.5 70691 68129 84 0 70691 33971 99 0
2.0 71781 68019 87 0 71781 34555 92 0
2.5 71999 70288 80 0 56294 31469 84 0
3.0 72834 72428 88 0 53234 31278 89 0
3.5 72113 72016 88 0 51796 30921 90 0
4.0 72052 69469 84 0 51534 33443 87 0
4.5 69599 78582 2 0 20099 19362 38 0
5.0 71856 73988 0 0 12486 12311 9 0
5.5 72045 72551 0 0 10819 10778 2 0
6.0 71088 71208 0 0 10504 10494 0 0
The "store" status is written to stderr and table into stdout. You
can do "./ethloop < prog > output". Now how to interpret output
table. First column is time in seconds (0.5 time increment is fixed).
Then for each flow there are four fields. In order these are: send
rate, recieve rate, delay and arbitrary field. Send rate should be
the same as you specified in the program and recieved is all what
was not dropped (thus should be lower). Delay is how long the packet
was in some queues. All these fields are averaged by EWMA with 1 sec
time constant.
The arbitrary four field in each flow has different meaning - generaly
it is copy of k1 .. k4 areas in packets - I use is to measure some qdisc
interna parameters. Kernel sets these to something and I can display
it. In code you can also with small change allow jitter to be displayed
here (the first delay derivative).
gnuplot output
Probably you want to see it graphically. Simple - store ethloop's output
into file "output", run gnuplot and type:
gnuplot> set data style lp
gnuplot> plot 'output' using 1:3,'output' using 1:7,'output' using 1:($3+$7)
gnuplot> set term gif small size 320,200
gnuplot> set out 'test.gif'
gnuplot> replot
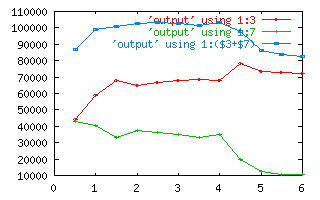 You should see output on your terminal and also test.gif should be written
as you see here. Also here you see what it is good idea to use SFQ - the
graphs are not so fair, are they ?
You should see output on your terminal and also test.gif should be written
as you see here. Also here you see what it is good idea to use SFQ - the
graphs are not so fair, are they ?
Command reference
For each command I describe format of its parameter first then function.
- X Both flowid and argument are ignored, exit Ethloop and output
measured data.
- i String. Set interface as incoming and outgoing for the flow.
- t String. Override outgoing interface only.
- S Number. Byte size of each packet in this flow.
- J Number. Jitter of packet size in bytes.
- R Number. Transmitter rate in bytes per second.
- P Number. Priocode set by setsockopt(sock,SOL_SOCKET,SO_PRIORITY,...). It
is very convenient way to test qdisc because majority of classfull qdisc
will use classid stored in priority field. To say that this flow should
go to class 3:4f use P 0x3004f. This way you need no filters.
- G Number. Priority jitter. The priority will be randomly changed in range
defined by P code and P+G. It allows you easy testing of qdisc with thousand
of active classes by naming them 1:7,1:8,1:9,1:a,1:b....1:fff for example
and set P 0x10007, G 0xff8 in one flow.
- s String. System command. It allows you to execute arbitrary command at some
time. Flowid is irelevant here and should be 0. system (2) call is used.
It is nice if you want to change setup of qdisc in the same measurement
(5000 s 0 tc class change root classid 1:1 prio 2).
Download
here is archive. Untar, make and go.
here is archive with program and script I used to generate HTB graphs.